SpaceX - successful launch
After the disappointing postponement of Saturday’s scheduled slot, SpaceX successfully launched their Dragon freight capsule on board the Falcon rocket. Watch the launch at the BBC. The importance of this cannot be underestimated…. it’s the first commercial resupply of an orbiting platform and part of NASAs strategy to offload near-Earth missions to lower-cost suppliers. As North Korea amply demonstrated, getting a satellite in to space is no easy feat and whilst SpaceX has been developing its capability for sometime, this is a significant leap forward. So, its got its cargo in to space and over the next few days it will perform a test manoeuvre to see if its systems are satisfactory for docking and then go for the real thing. A real historic moment.
Inkscape
It’s now new, however for those not in the know Inkscape is the grand-daddy of open-source vector graphics software. There is a strong and continuous development cycle and whilst it is still going to be sometime before a full version 1 release is available, it is an impressively featured and powerful piece of software. As ever, its downloadable as cross-platform and available on Windows as a portable version. It has a extension architecture that supports an ever expanding set of functions.
There is no better advert for a product like this than the images it can produce….. take a look at the Inkscape Tutorials Blog and Open Clip Art library (although not all are created with Inkscape on the latter). I’ve used Inkscape on-and-off for a while (including for DTP jobs where I find it more intuitive and powerful than Scribus, although maybe I need to spend some more time with the latter!) but thought I’d follow one of the tutorials to produce something, so I plumped for the coffee cup with the results below…. OK, it’s hardly going to win anything, but the results are impressive for a relatively straightforward tutorial (besides the crappy handle…. just never quite seem to be able to crack bezier curves). Worth a gentle introduction and keeping tabs on the manual me thinks.

Are you out there?? Andy Wilson GIS MSc (09-11)
Andy (or someone still in touch with him!), wondered if you could get in touch.cheersmike
Conference: Objective Geomorphological Representation Models
The IAG/AIG WG on Apllied Geomorphological Mapping (http://www.appgema.net/), together with the Italian Association of Physical Geography and Geomorphology (AIGEO), the University of Salerno, with the support of National Park Cilento and Vallo di Diano, and Geoparks are organizing an International Workshop on “Objective Geomorphological Representation Models: Breaking through a New Geomorphological Mapping Frontier” on 15-19 October 2012, in the Salerno University Campus, Italy. This comes as a natural follow up on the recently published book ‘Geomorphological Mapping methods and applications’ edited by the AppGeMa IAG WG.
Four renowned Key Note Lectures, oral and poster session will be hold, and a field excursion to discuss the geomorphological mapping of a landslide on the coast of the Tyrrhenian sea (Cilento and Vallo di Diano Geopark).
More information and the registration form are available on the IAG website http://www.geomorph.org/main.html
Deadlines Summary:
Registration August 31, 2012
Abstract submission June 30, 2012
Abstract acceptance July 31, 2012
Looking forward to seeing you in Salerno!
NDVI Differencing
During my remote sensing class in the fall term I cover some introductory level image processing techniques that can be used in quite profound ways. If we have a multi-spectral image with each layer imaging the Earth at different wavelengths, how can we manipulate that? Well, one very common technique is a ratio (divide one wavelength by another), giving you the proportion of variation of one layer relative to another. Where this is powerful is when you have two diagnostic wavelengths unique to your surface of interest (e.g. green and red), with very large differences in reflectance. This allows you identify very subtle variations in your target wavelengths. For vegetation, green and NIR are ideal wavelengths and the Ratio Vegetation Index does this. However its not comparable to other RVI measurements (and can vary to infinity), so its common to normalise (i.e. look at the range rather than absolute values) this calculation, a measurement called the Normalised Difference Vegetation Index. This gives you the amount of “greenness” and is calculated operationally as a product for many satellites. Its powerful for monitoring vegetation and is used extensively for things like crop-management and deforestation.
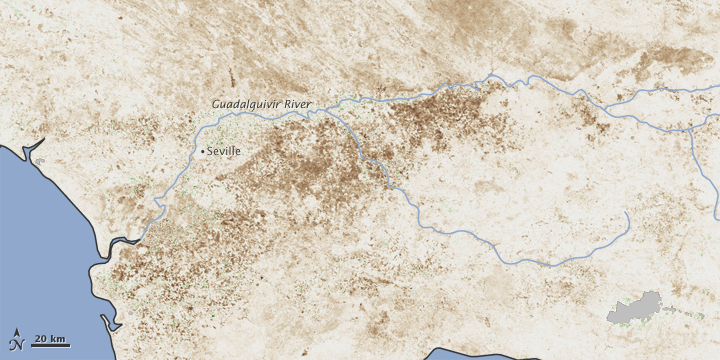
On their own, many of these techniques offer significant insights about the environment. However in combination, they allow you to perform complex tasks and create greater understanding. Another common process is to subtract two images at different time periods allowing you see the change that has occurred; very effective for temporal analysis. And, of course, when combined with the NDVI you get to see change in vegetation through time.
What kicked this blog entry off was a really good NASA Image of the Day which shows the dramatic effect of drought and decreasing vegetation in Spain. For robustness the NDVI average over a 16-day period this spring is taken and then subtracted from the overall average. Using the data the USDA have been able to estimate the yield and therefore the shortfall in harvest against need and so the approximate requirement for import. For me, it is this simple work that shows the importance of operational remote sensing at an international, national, regional and even individual level. It affects everyone.